Basic Statistical Analysis and Optimization in Python (Scipy/numpy) (Part I)
- Carl
- 2016年1月24日
- 讀畢需時 2 分鐘

In the first part, I am going to talk about some basic statistics usage of Python and in the following part I will try to use various method to optimize some constrain/ unconstrain mathematical problem.
# K-S test and T test
In statistics, the Kolmogorov–Smirnov test (K–S test or KS test) is a nonparametric test of the equality of continuous, one-dimensional probability distributions that can be used to compare a sample with a reference probability distribution (one-sample K–S test), or to compare two samples (two-sample K–S test).
Now let's do some coding!
#1. KS test
First, we construct a normal distributed sample dataset using .rvs command. Then using scipy.stats's KS test command to see wheather it is a normal distributed random variable with sample mean and standard deviation.
********************************************************************
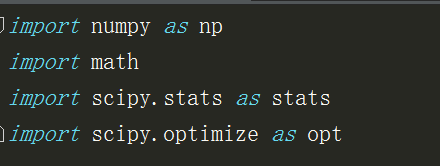
import numpy as np import scipy.stats as stats import scipy.optimize as opt
data1=stats.norm.rvs(size=2000,loc=0.5,scale=2) sample_mean1=np.mean(data1) sample_std1=np.std(data1)
#KS test, test wheather the sample is normal distributed sta_D,pval=stats.kstest(data1,"norm",(sample_mean1,sample_std1)) print "Result of KS-test of sample 1:" \ "D=%6.2f, p-value=%6.2f"%(sta_D,pval)
the result show p-value is 0.79 which is greater than 0.05, so we can say it is very likely that the sample is normal distributed (it is , obviously)
*****************************************************************************
#1. T-test
A t-test is any statistical hypothesis test in which the test statistic follows a Student's t-distribution if the null hypothesis is supported. It can be used to determine if two sets of data are significantly different from each other, and is most commonly applied when the test statistic would follow a normal distribution if the value of a scaling term in the test statistic were known. When the scaling term is unknown and is replaced by an estimate based on the data, the test statistic (under certain conditions) follows a Student's t distribution.
We perform two kinds of t-test : one sample t test and two samples t test.
* one sample t test:
****************************************************************************
data1=stats.norm.rvs(size=2000,loc=0.5,scale=2) sample_mean1=np.mean(data1) sample_std1=np.std(data1) # T test, test the mean and standard deviation tsta_D, tpval=stats.ttest_1samp(data1,0) print "Result of T-test of sample 1:" \ "D=%6.2f, p-value=%6.2f"%(tsta_D,tpval)
Also, the result p-value shows we can reject the null hypo that the true is 0. (easy to see, we generate the sample data with mean 0.5 )
***************************************************************************
** Two sample t test:
Here, we are trying to determin wheather the two sample is generated by the random variables with same mean.
*****************************************************************************************
import numpy as np import scipy.stats as stats import scipy.optimize as opt
data1=stats.norm.rvs(size=2000,loc=0.5,scale=2) sample_mean1=np.mean(data1) sample_std1=np.std(data1)
data2=stats.norm.rvs(size=1000,loc=-0.2,scale=1.2) sample_mean2=np.mean(data2) sample_std2=np.std(data2)
#KS test, test wheather the sample is normal distributed sta_D,pval=stats.kstest(data1,"norm",(sample_mean1,sample_std1)) print "Result of KS-test of sample 1:" \ "D=%6.2f, p-value=%6.2f"%(sta_D,pval)
# T test, test the mean and standard deviation tsta_D, tpval=stats.ttest_1samp(data1,0) print "Result of T-test of sample 1:" \ "D=%6.2f, p-value=%6.2f"%(tsta_D,tpval)
# Two sample T test, test wheather the mean of two samples in the same twotD,twotpval=stats.ttest_ind(data1,data2,equal_var=False) print "Result of two samples T-test of sample 1 & 2:" \ "D=%6.2f, p-value=%6.2f"%(twotD,twotpval)
************************************************************************


留言